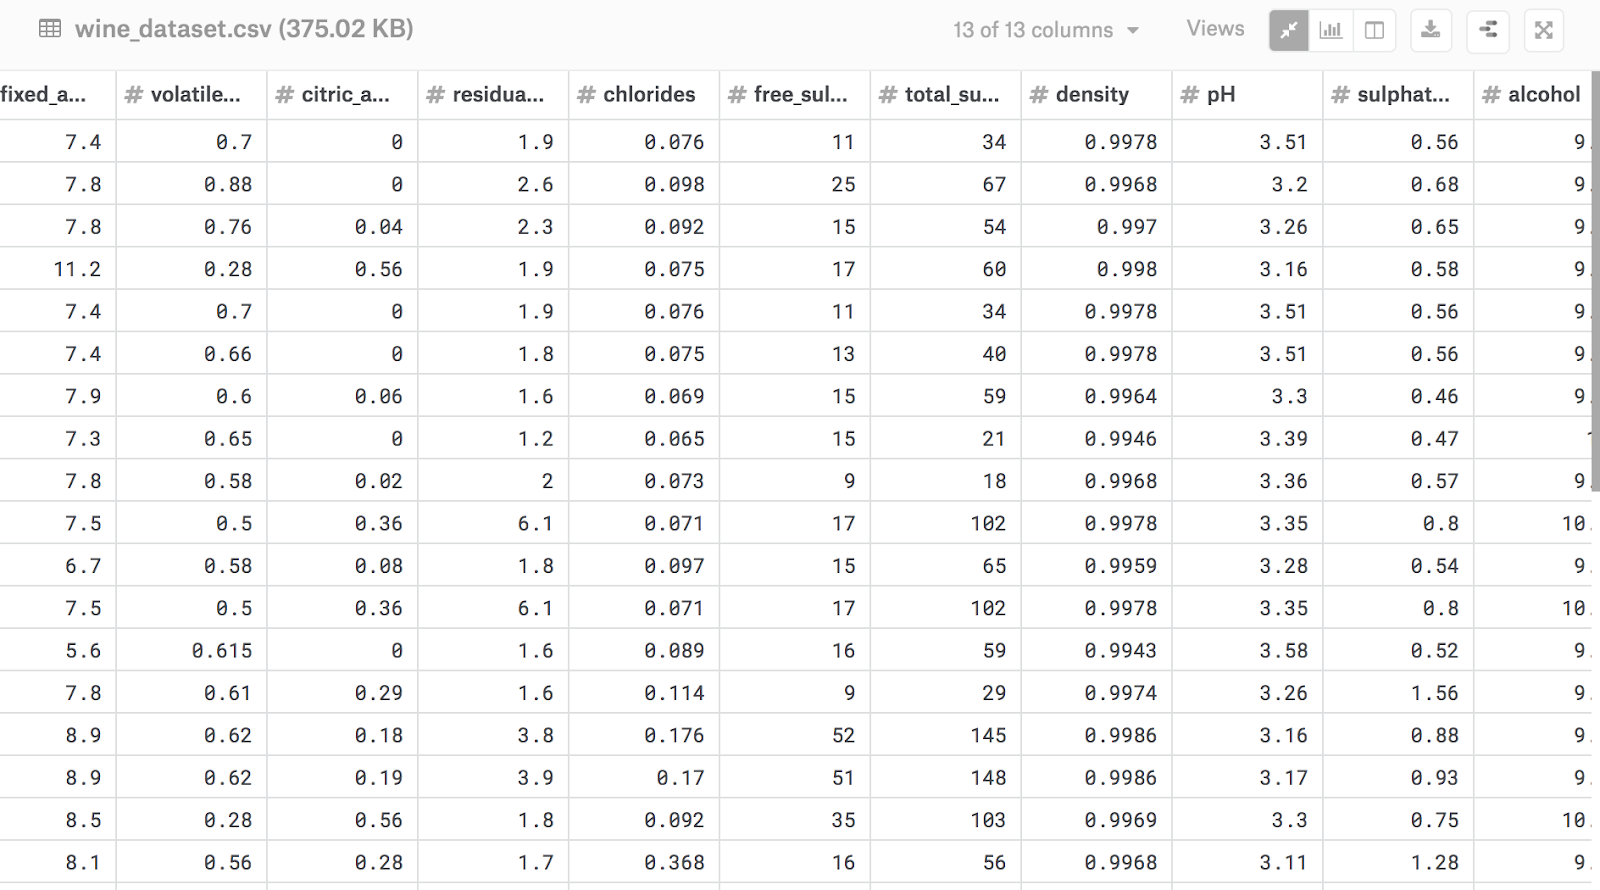
Data Overview
- The data contains 6497 observations of 13 variables.
- Each row pertains to the compositions of wine from which can determine whether its red or white wine.
- Our aim is to predict whether the wine style is red or white based on its composition.
Data Cleaning
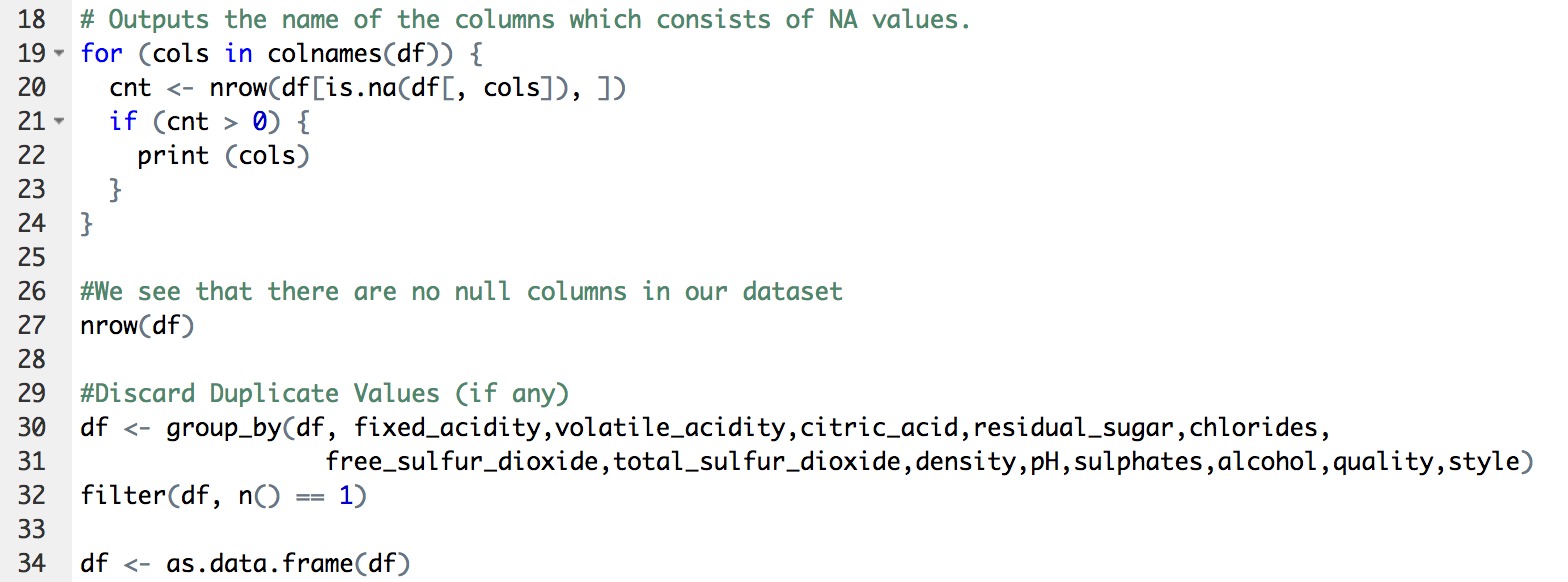
- Check for null values in all the variables
- No null values found in the data.
- Discard duplicate values, if any
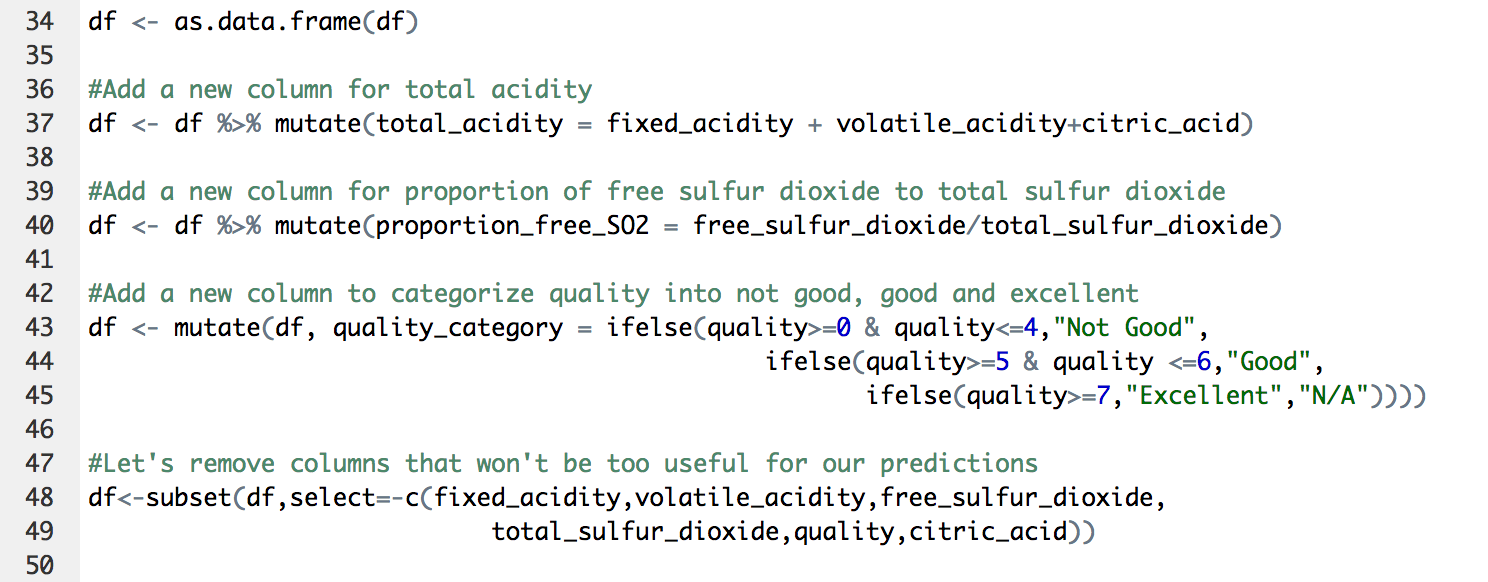
Create new relevant variables and dropping the variables we will not use:
- In wine tasting, the term “acidity” refers to the fresh, tart and sour attributes of the wine which are evaluated in relation to how well the acidity balances out the sweetness and bitter components of the wine such as tannins. We create a new column for total acidity.
- Free sulfur dioxide: the part of the Sulphur dioxide that is added to a wine and that is lost into it is said to be bound, while the active part is said to be free. Winemaker will always try to get the highest proportion of free Sulphur to bind.
- We also have the qualities of the wines given from 1 being the lowest and 10 being the highest. We will create a new column to group the quality into not good, good and excellent and see if there is a significant effect of quality to categorize red or white wines.
Let us try to classify our observations into ‘red’ or ‘white’ wines using Decision Trees.
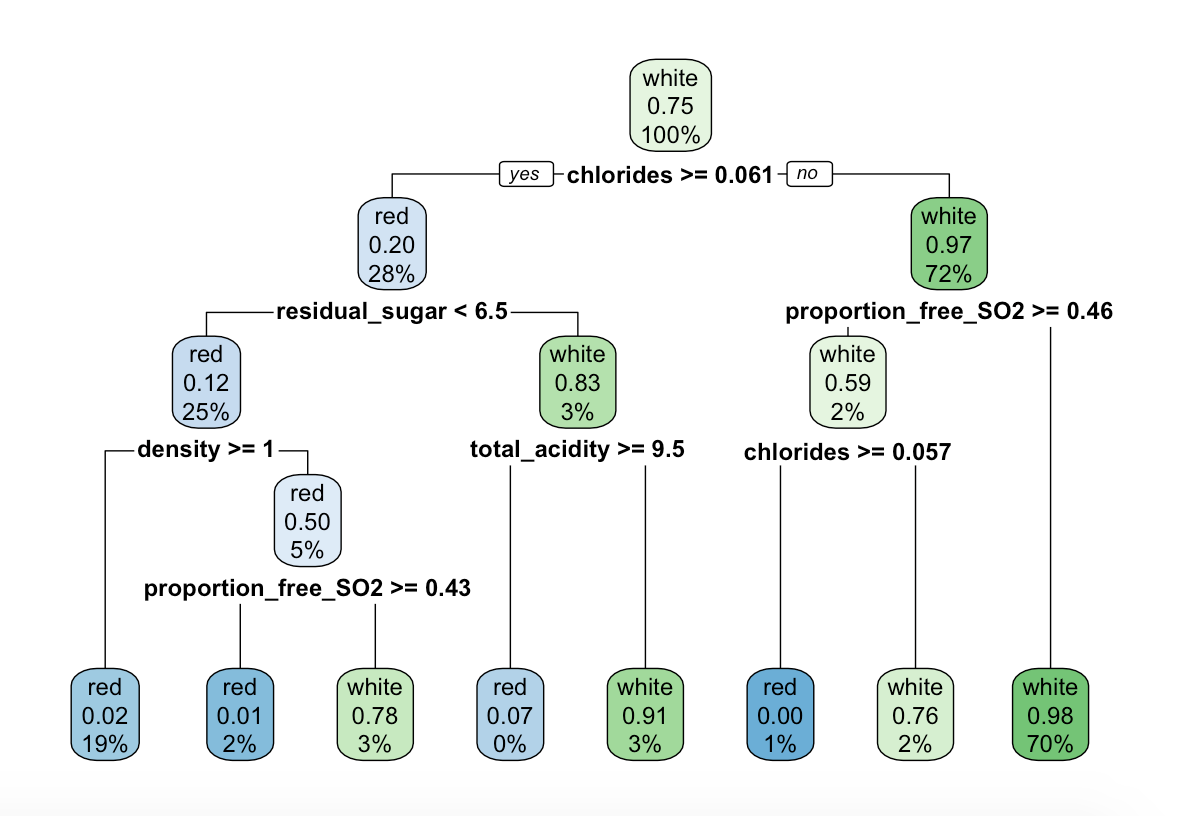
Decision Tree
From the decision tree in the left, we see that:
- Chlorides (saltiness) is the most important factor in classifying red and white wines. 72% of the data has less than 0.061 units of chlorides and 97% of those are white wines. Thus, we see that red wines have more chlorides than white wines and are more saltier than white wines.
- Other important features for the red and white wine classifications are residual sugar, proportion of free SO2, Density and total acidity.
- Another interesting observation is that quality category was not considered at all in the decision tree, which suggests that the qualities for red and white wines are comparable and not a distinctive feature for their classification.
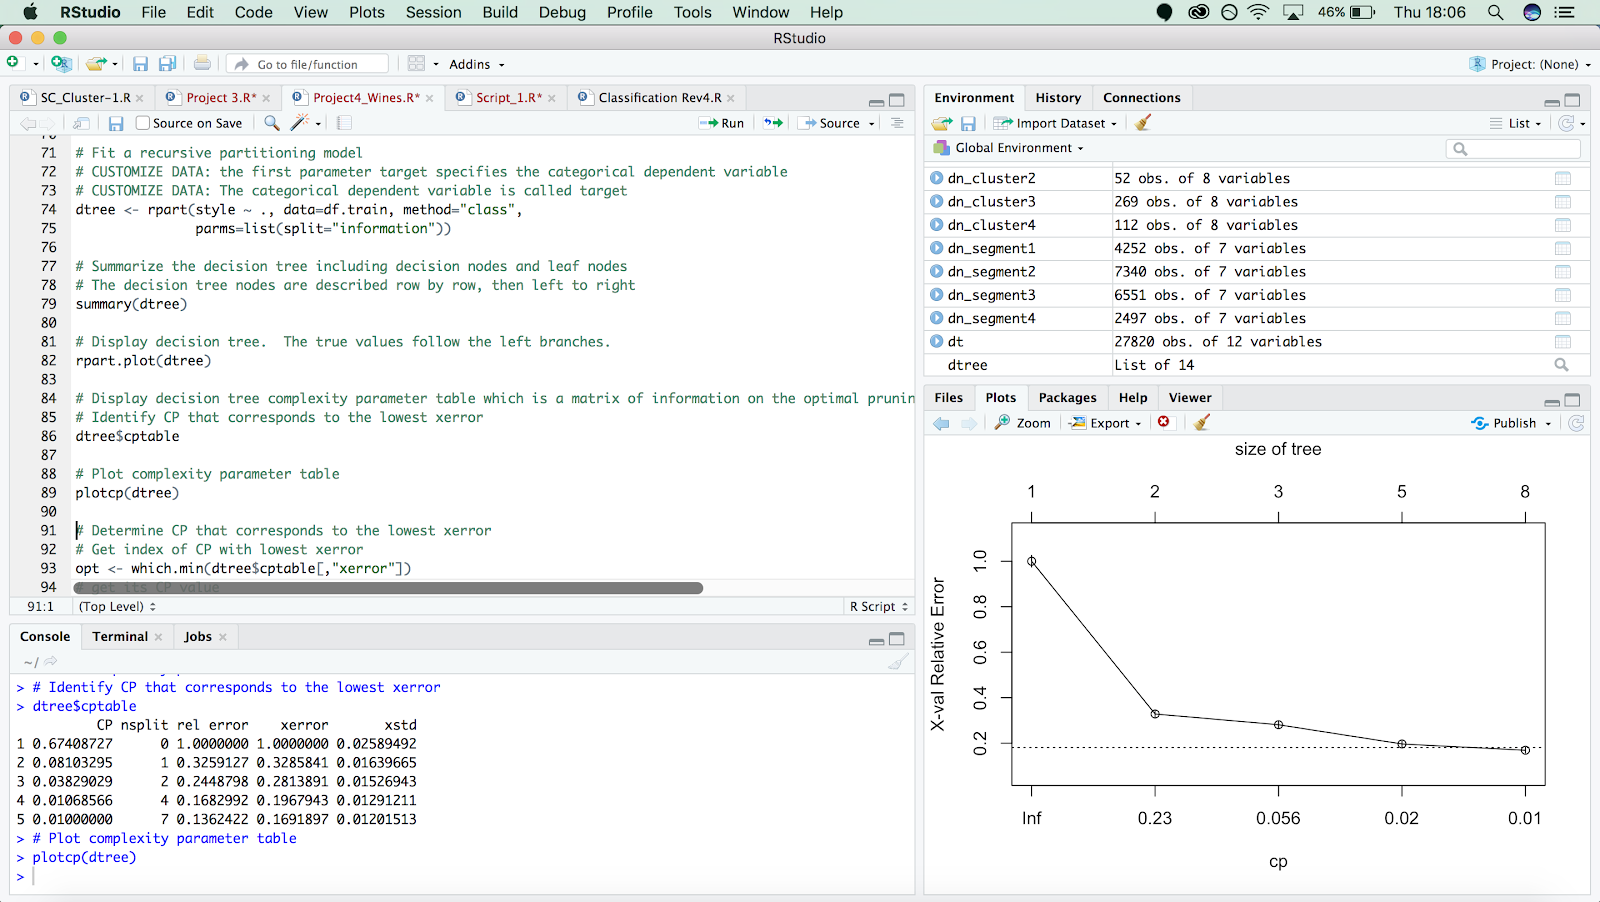
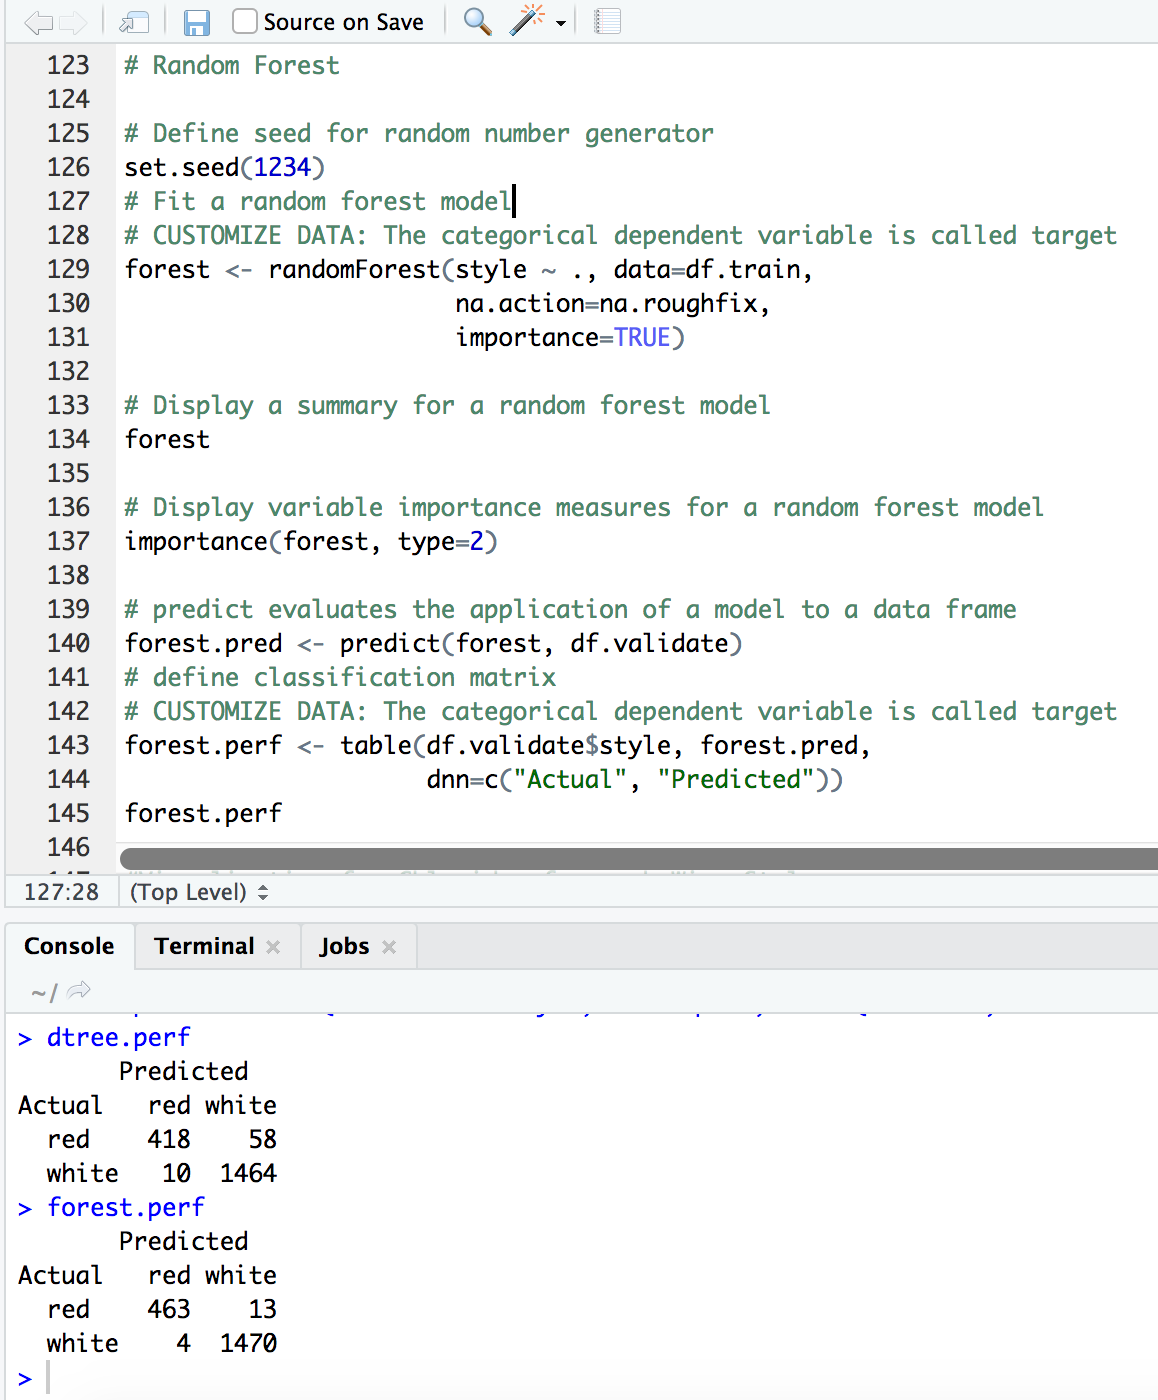
Random Forest
We see the performance of dtree on our predicted data is :
- Wrong predictions: 58 + 10 = 68
- Total predictions: 1950 records
- Performance= (1- (68/1950)) * 100
- Thus, our model is 96.52% accurate.
We use random forest to try and increase the accuracy of our model.
From the forest performance we see that:
- Wrong predictions: 13 + 4 = 17
- Total predictions: 1950 records
- Performance= (1- (17/1950)) * 100
Our model now is 99.12% accurate. We can thus use our random forest model to successfully classify a given wine observation into red or white wine with 99.12% accuracy.
Visualization for Chlorides for each Wine Style
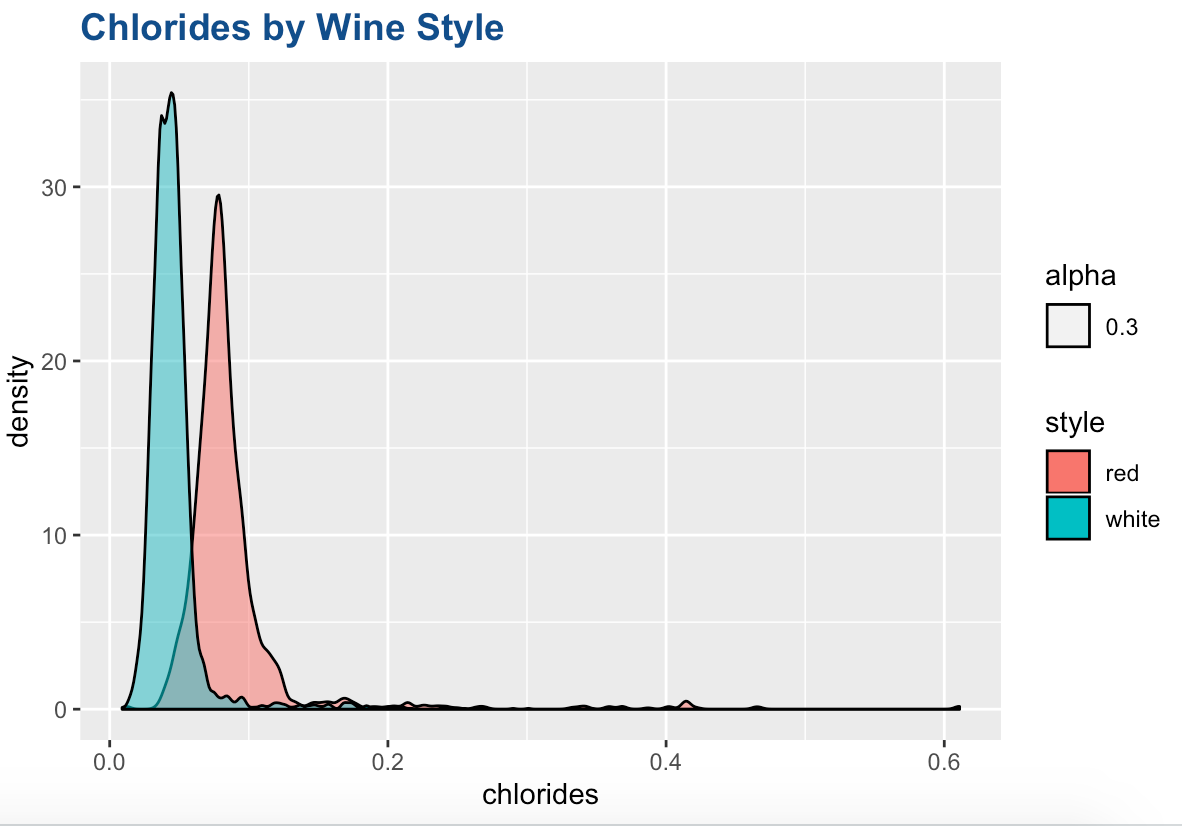
From the graph we see that,\ The density graph for Chlorides shows us that chlorides concentration is significantly lesser in white wines than red wines.
What does this imply?
The amount of chloride in wine is influenced by both the terroir and type of grape, and the importance of quantification lies in the fact that wine flavor is strongly impacted by this particular ion, which, in high concentration, gives the wine an undesirable salty taste and significantly decreases its market appeal.
Visualization between Residual Sugar by Total Acidity
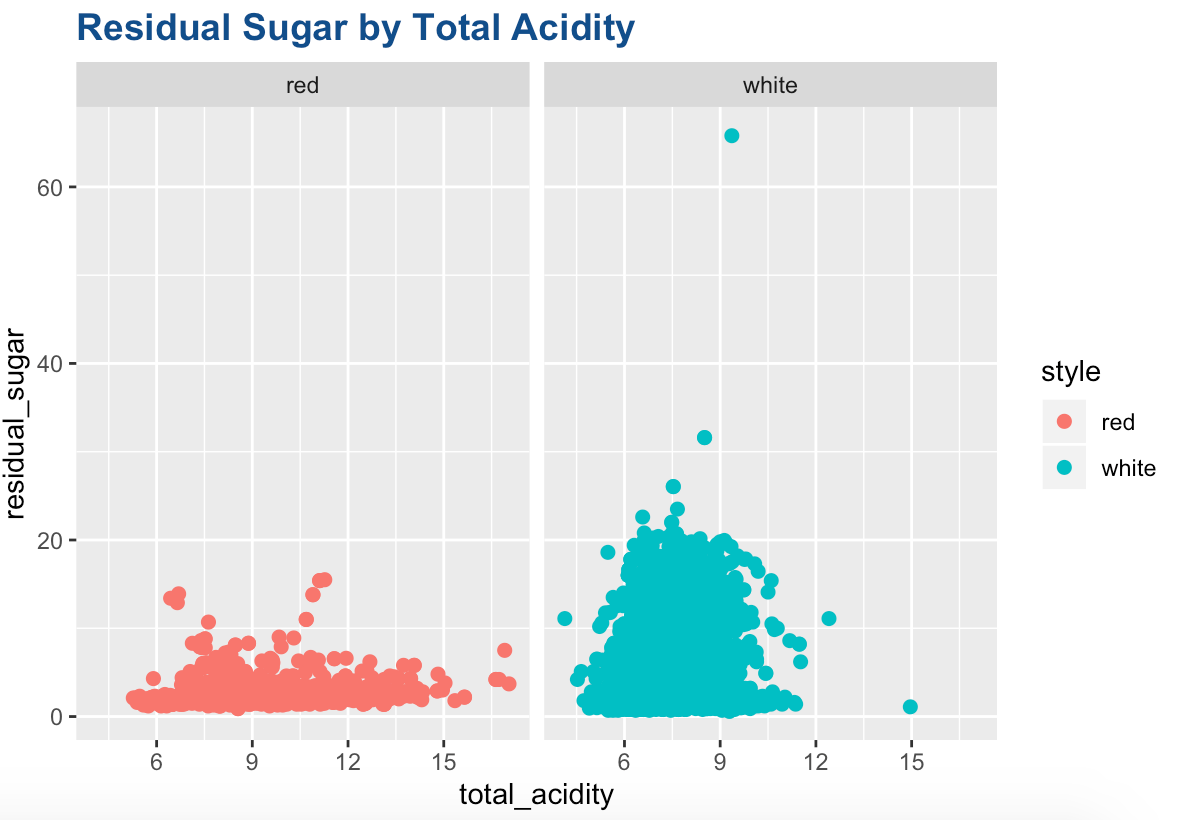
All wines are inherently acidic with a pH between 2-4.\ Residual Sugar (or RS) is from natural grape sugars leftover in a wine after the alcoholic fermentation finishes. It’s measured in grams per liter.
We see that the residual sugar is higher for white wines as compared to red wines hence we can say that they are relatively sweeter with more carbs as compared to red wines.\ We also see that the total acidity is higher for red wines as compared to white wines.
Visualization between Alcohol and Density
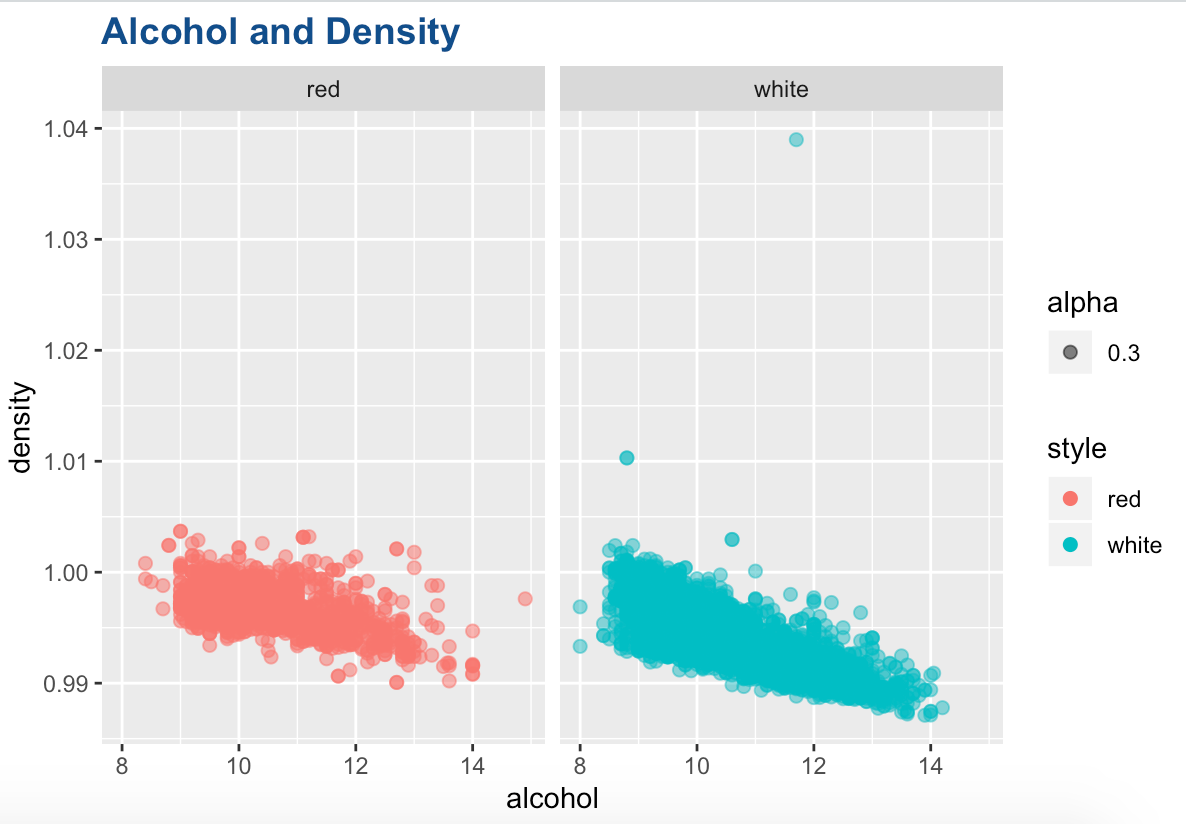
The graph above shows us the volume of alcohol in the wine by its density.
We see that alcohol and density are inversely related. This implies that the wines with higher volume of alcohol in them tend to have a lesser density.
This can be attributed to the fact that alcohol has less weight by volume as compared to water and other liquids. Thus, the more alcohol vs other liquids a wine contains should decrease the overall density of the wine.
Further we see that, white wines have a slightly higher alcohol percentage and hence lower densities as compared to red wines.
Visualization between the proportion of free SO2 by volume of Alcohol
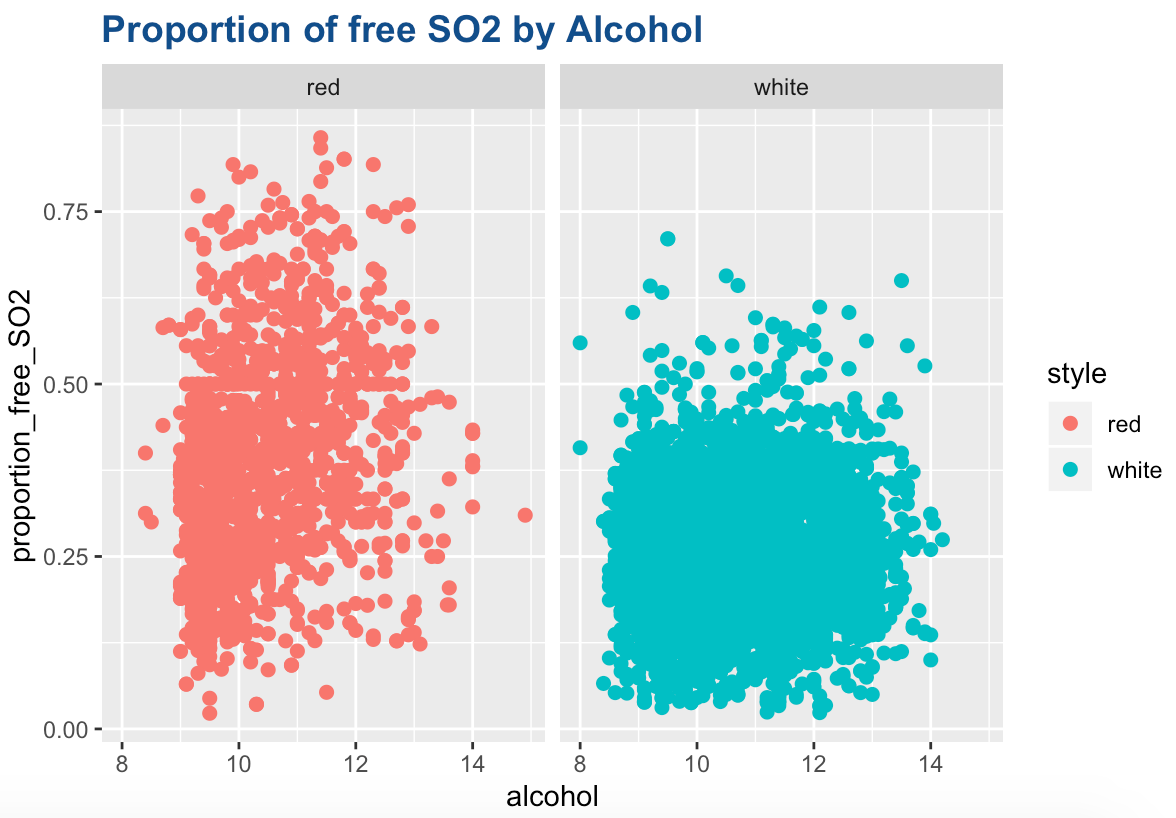
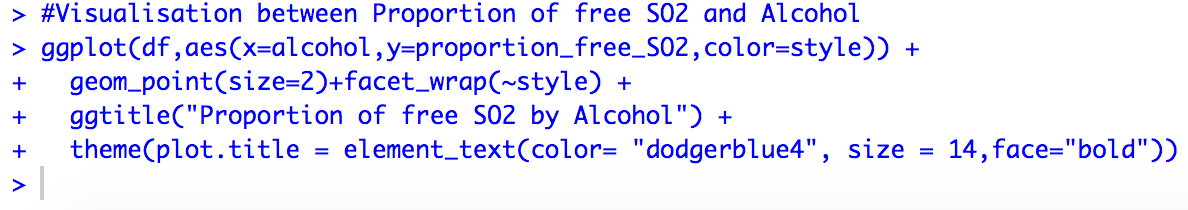
Sulphur dioxide (SO2) is the most widely used and controversial additive in winemaking. Its main functions are to inhibit or kill unwanted yeasts and bacteria, and to protect wine from oxidation.\ ‘Free’ SO2 is that which is unbound to compounds in the wine and is therefore able to exert an antioxidant/preservative action. ‘Bound’ SO2 is that which has already been complexed to other compounds in the wine (such as sugars) and has essentially been quenched such that it no longer has antioxidant/preservative activity. Total SO2, is the sum of both of these forms.
We see that red wines in general have higher proportion of free SO2 compared to white wines.\ We also see that there is less variation in the alcohol volume in red wine as compared to white wine.\ This could also be due to lesser number of observations for red wine.
Is white wine better or red?
Now that we have seen the relationships between the variables that affect the classification of wines, let us use the quality variable to see if the quality of one wine is better than the other.\ Let us compare the ‘Excellent’ and ‘Not Good’ categories to better understand the influences on wine quality categories.
Visualization between total acidity and product category
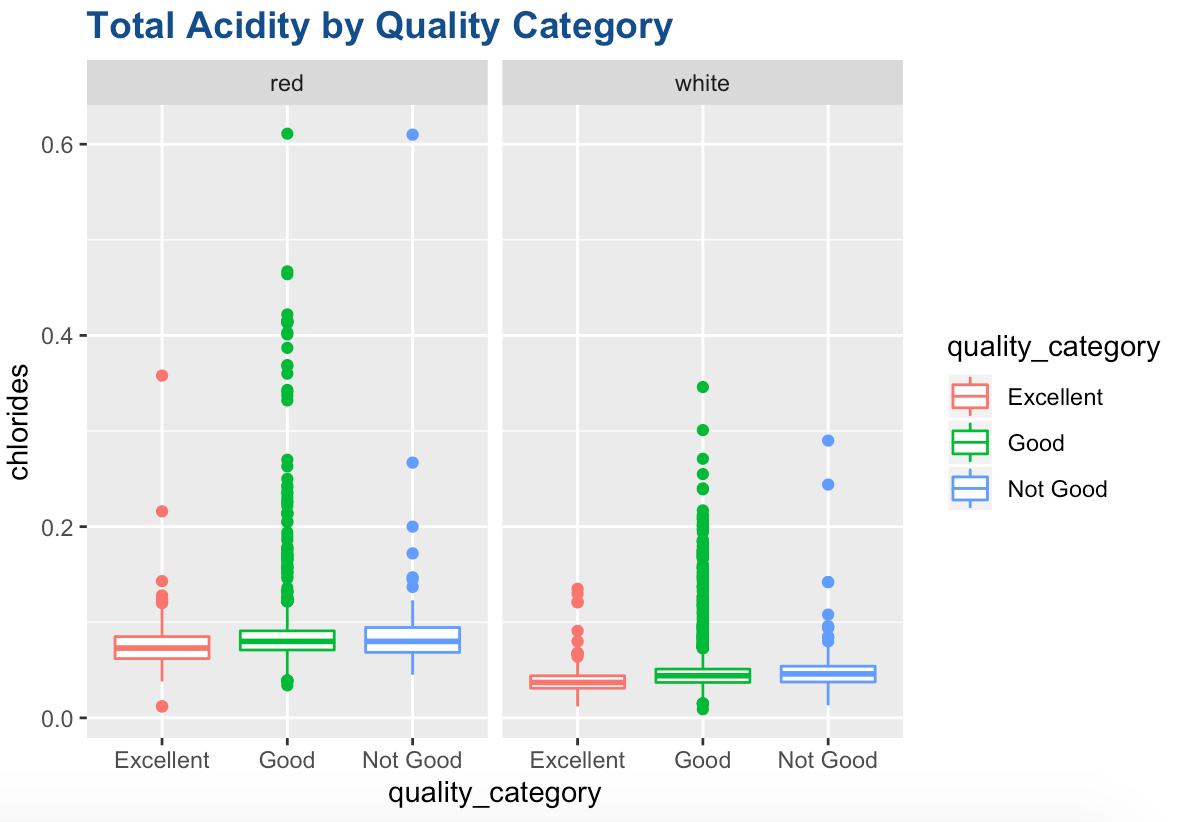
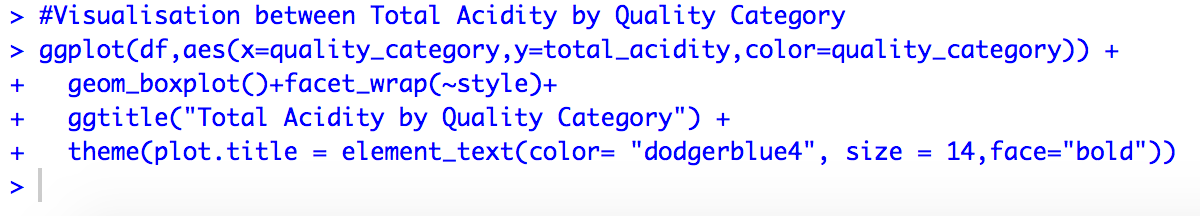
From the graph we see that:
- The chlorides in red wine are higher for all categories compared to white wine.
- We also see that the ‘Excellent’ wines tend to have lesser levels of chlorides as compared to the ‘Not Good’ category.
- This implies that high level of chlorides are generally not preferable in wines.
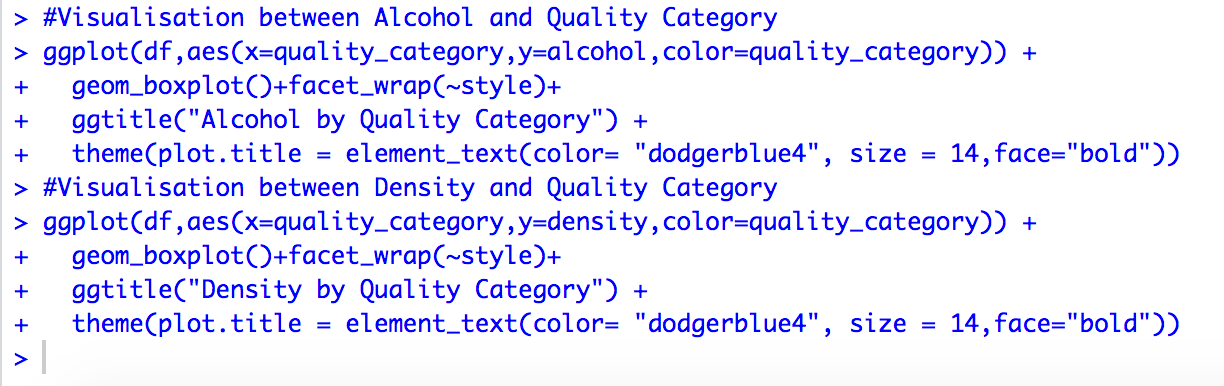
Visualization between Alcohol/Density and Quality Category
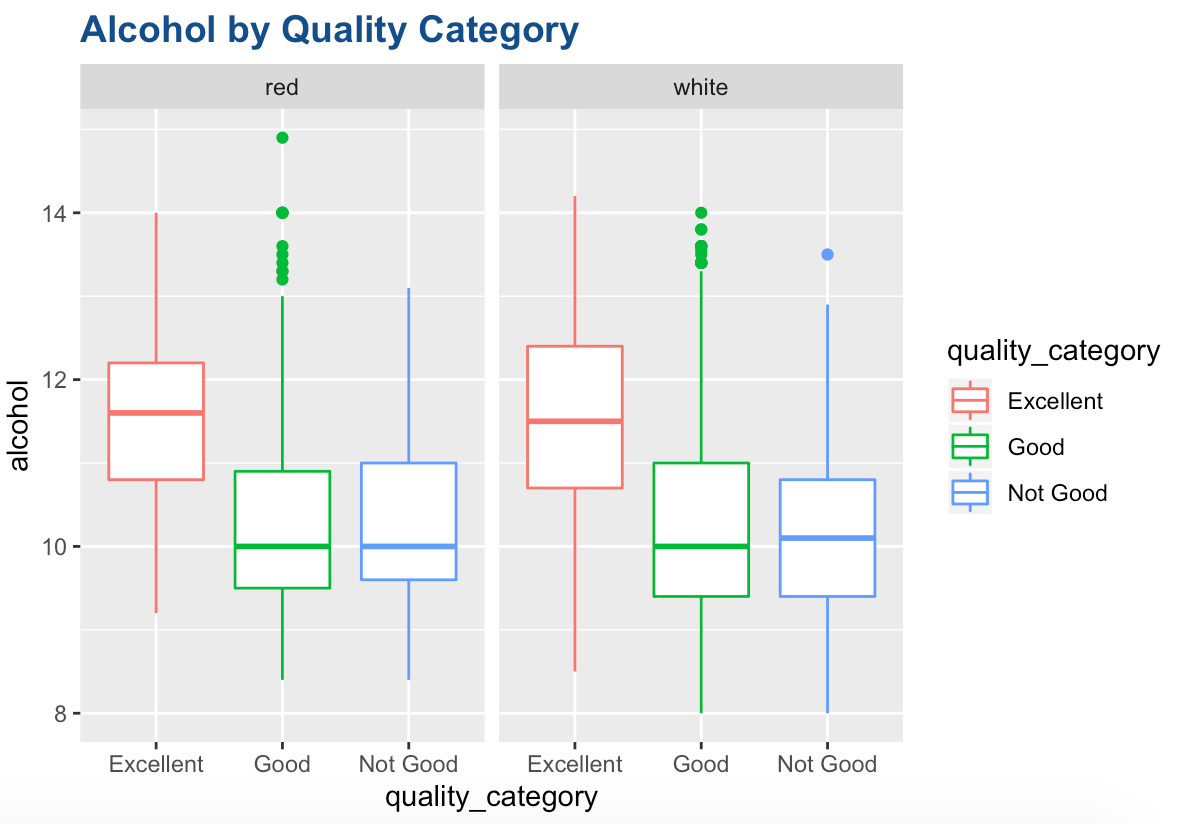
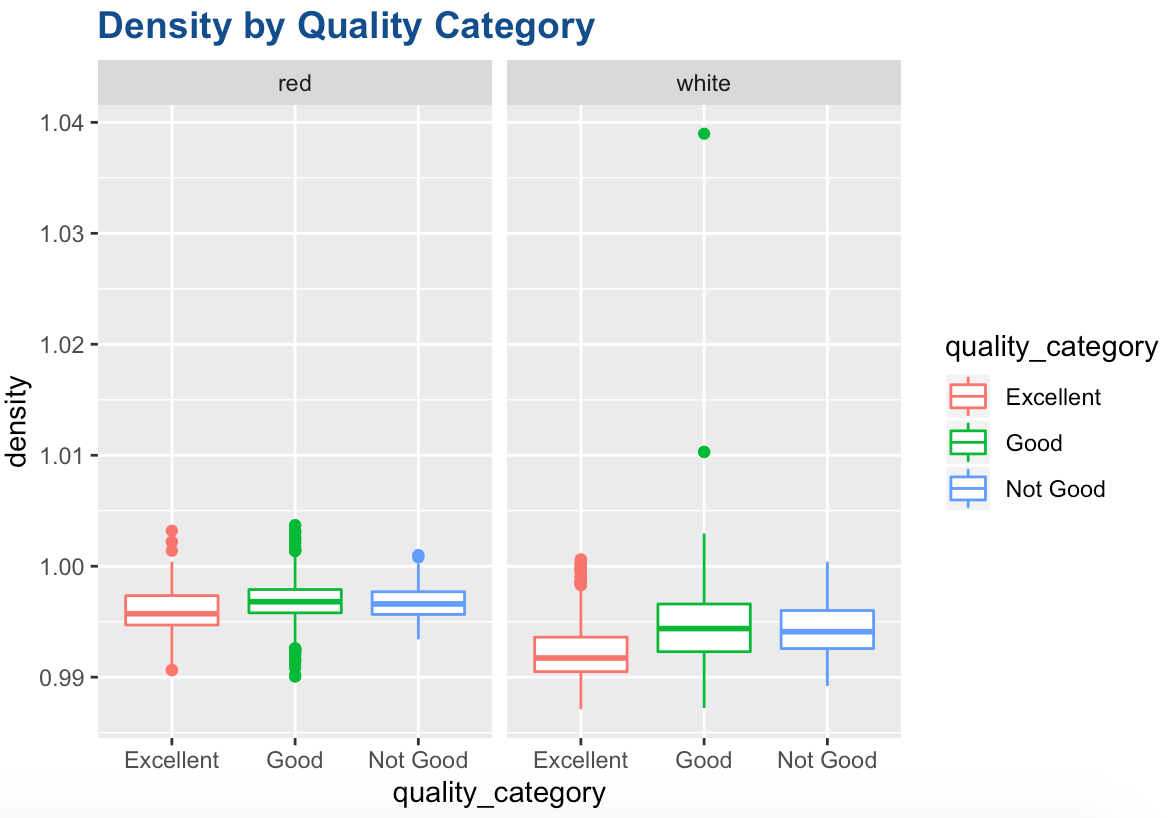
As we saw earlier, alcohol content and density are inversely related.
From the graphs we see that:
- The alcohol content is generally higher for the “Excellent” category wines and less for the “Not Good” wines.
- The density of wines is preferred to be lesser for a better quality wine.
- The alcohol content is comparable in red and white wines but slightly higher in “Excellent” white wines.
Visualization of Residual Sugar by Quality Category
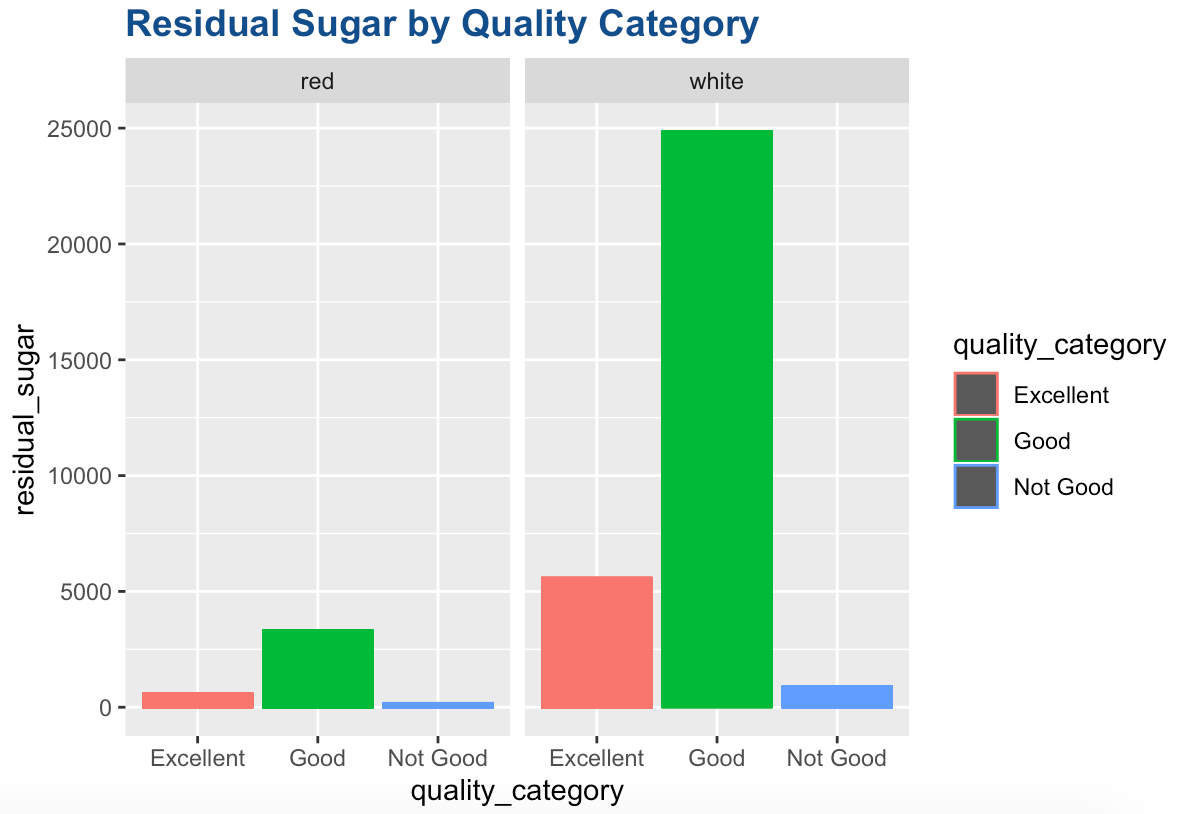
From the graph we see that:
- Residual sugar is much higher in “Good” white wines as compared to other categories.
- Residual sugar is generally higher in white wines as compared to red wines.
- This implies that white wines are generally ”sweeter” than red wines.
- This in turn also implies that white wines have higher “carbs” as compared to red wines.
Visualization between Total Acidity and Quality Category
The acidity of a wine is one of its most appealing characteristics, enhancing its refreshing, crisp qualities as well as enabling wines to be paired with foods so successfully. Acidity complements foods in a palate-cleansing, refreshing manner.
An important point to remember is that the perception of acidity, as with other flavor components in wine, should not be considered independently. Sweetness and acidity, for example, balance each other. A wine high in acidity that also has a bit of sweetness will seem less acidic.
From the graph we see that:
- ”Excellent” red wines have a higher total acidity as compared to “Not Good” red wines. However, few “Not Good” white wines have higher levels of acidity as compared to the “Excellent” white wines.
- In general, the red wines appear to have a higher “total acidity” as compared to white wines.
Insights/Hypotheses
- We see that the quality of wines (red and white) depends on a combination of different features and we cannot say one type of wine is better than the other. This could further be seen that the quality was not a factor in classifying the wines into ”red” or “white”.
- According to our model, we see that the chlorides in the wines are a major differentiating factor for red and white wines. We recall, red wines have higher chloride levels as compared to white wines. Most wines are made from fresh grapes from a vineyard. The mineral content of the soil is always reflected in the grape’s flavor to some degree and since the areas near the coast have higher chlorine levels, it is interesting to see that:


- From the data we see that, wines are generally acidic with a pH between 2.5 to 4.5. The acidity of the wines complements the food in a pleasant manner and thus many people prefer to have wine with their food.
- Our visualizations show us that, generally, wines with a higher alcohol content and lower densities (inversely related) are considered better. This could be because: Higher alcohol is an indication of better ripeness at harvest and fermentation to complete or near-complete dryness.
- From our visualizations we also see that white wines tend to contain higher residual sugars as compared to red wines and thus higher carbs comparatively.
- Finally, though added sulfites may sometimes cause negative side effects in some people, SO2 plays an important role in preventing oxidization and maintaining a wine’s freshness. We see from our graphs that red wines have a slightly higher ratio of free SO2 by total SO2 (proportion of free SO2).
However, more analysis would be required to prove the above insights/hypothesis. Another thing to keep in mind is that there was relatively higher number of observations in the data for white wines as compared to red wines. There were also more observations for the “Good” category wines as compared to ”Not Good” and “Excellent” quality categories. This might cause our analysis to have some discrepancies.